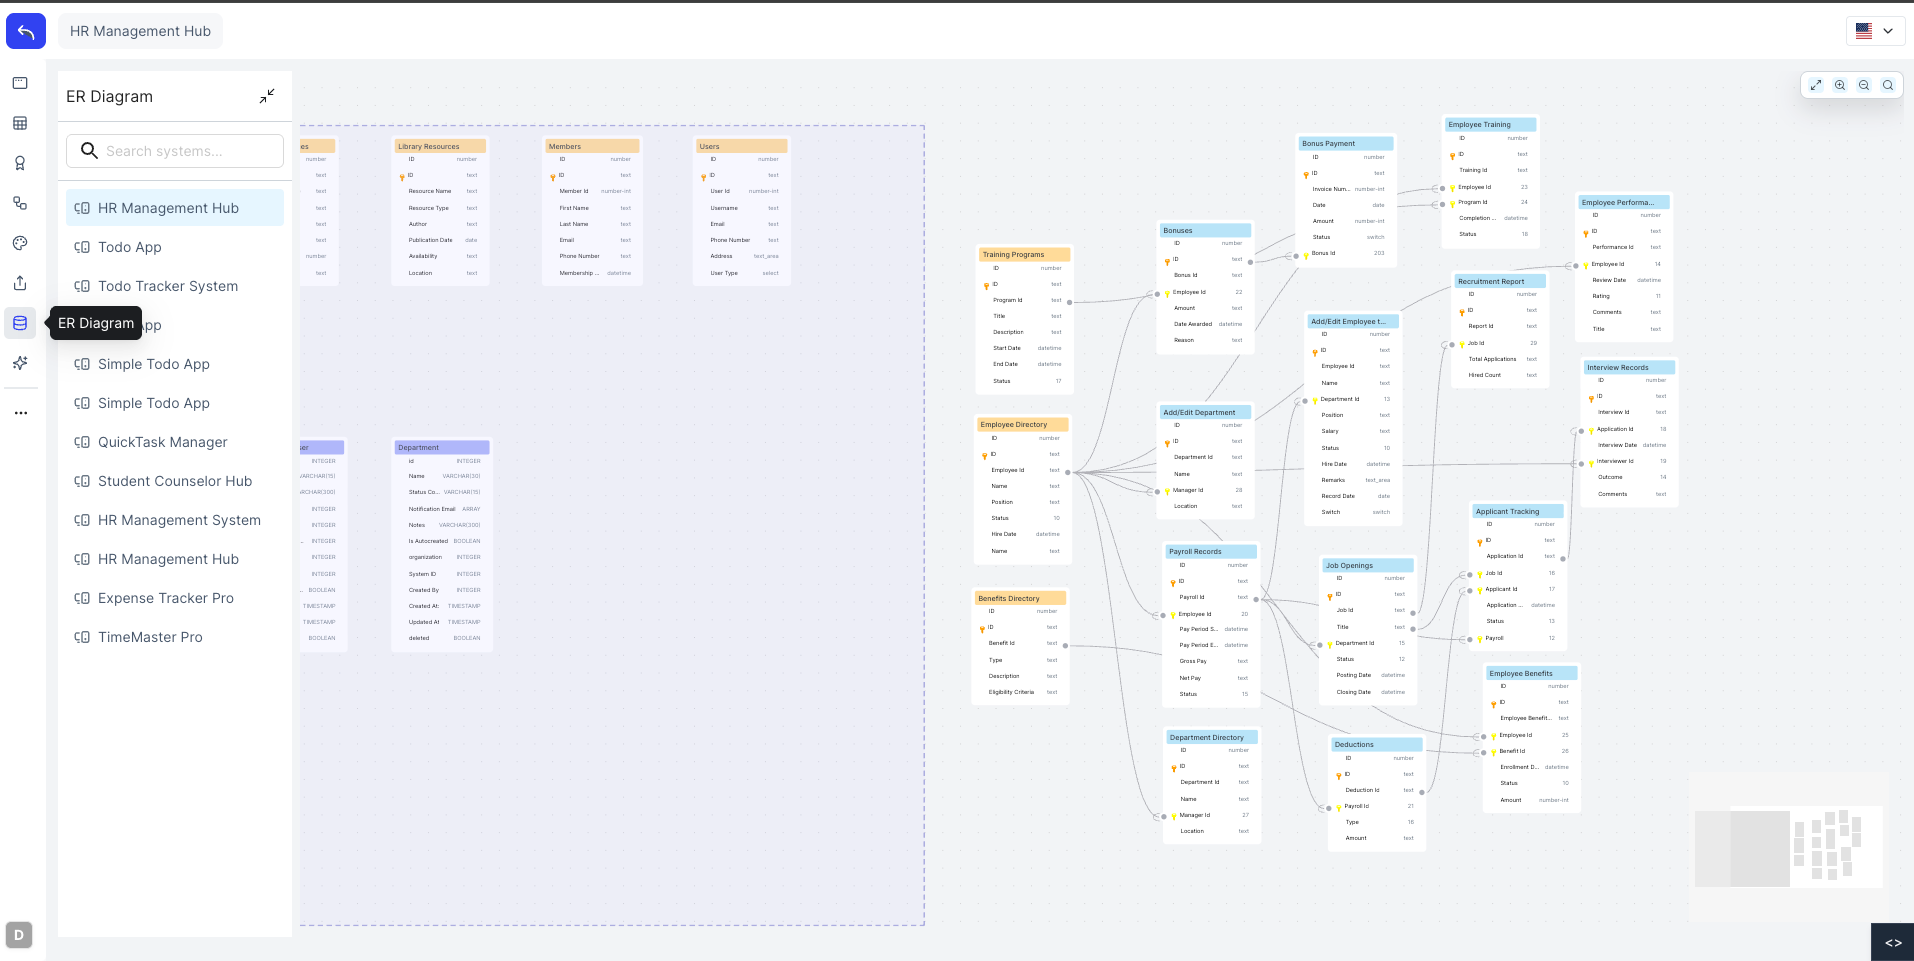
ER Diagram
The ER Diagram gives you a visual map of all the tables in a system and how they relate to each other. You can use it to understand the data structure, trace relationships between windows, and rearrange the layout for easier reading.
Accessing the ER Diagram
In the sidebar, click ER Diagram. The left panel lists all available systems. Select a system to load its diagram on the canvas.
Reading the Diagram
Each table on the canvas shows its fields and their data types. Tables are color-coded by type:
| Color | Type |
|---|---|
| Yellow / Orange | Tables with no relation fields |
| Blue / Teal | Tables with foreign key relationships |
| Purple | Internal system tables |
Lines connecting tables represent relationships. Click on a line to highlight that relationship and trace which fields are linked.
Navigating the Canvas
Use the zoom controls in the top-right corner to zoom in or out. Click and drag any table to reposition it on the canvas. The layout is not saved, it resets when you reload the diagram.