Create and Manage Dashboards
Overview
In the Business Intelligence module, you can create dashboards by selecting charts, filtering them, and organizing them on a canvas.
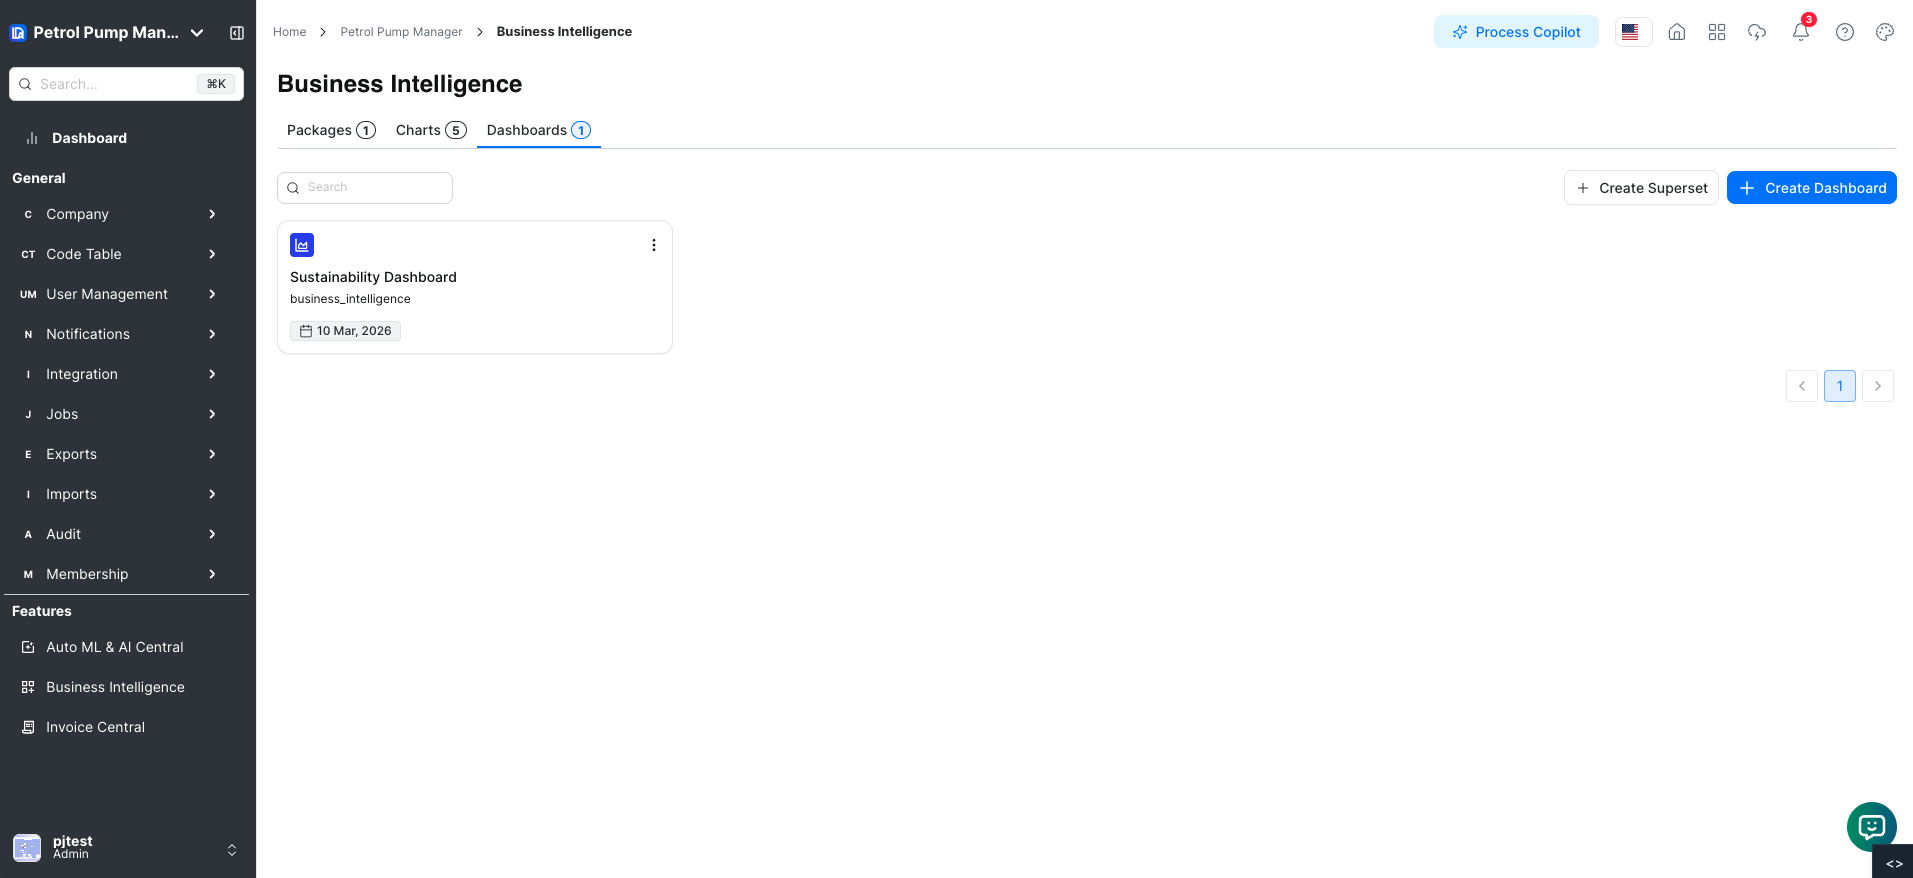
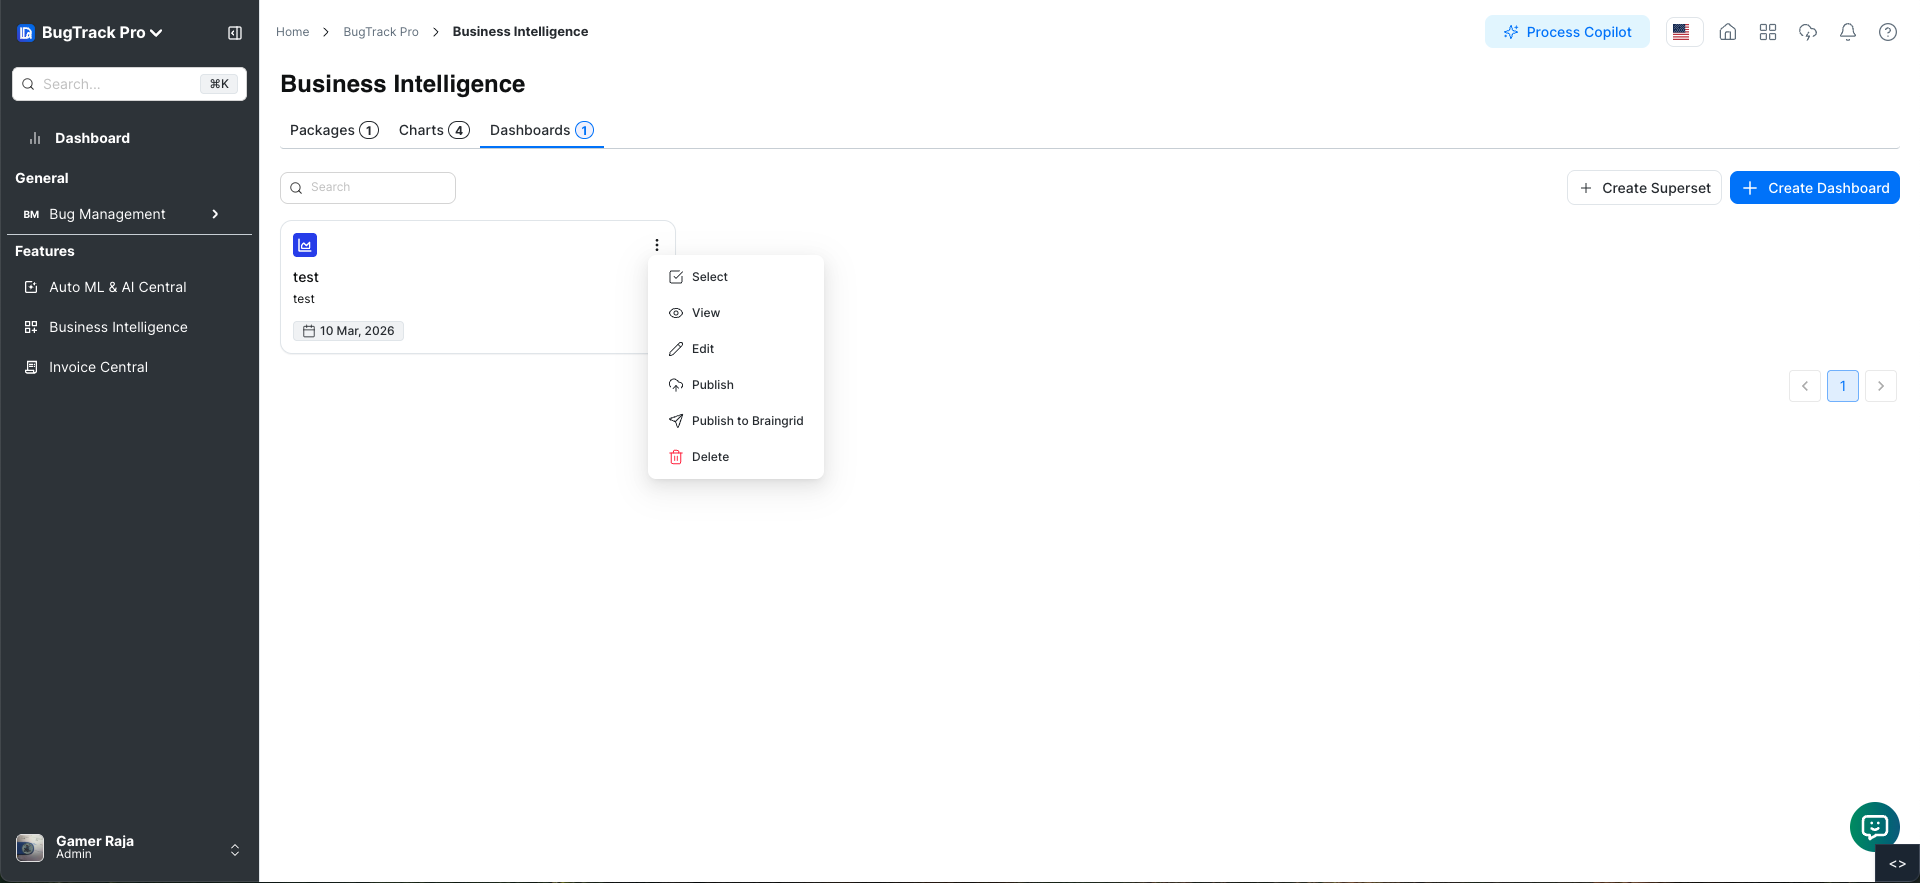
Each dashboard card provides a menu icon with multiple management options:
- Select - Select the Card
- View – Open in view-only mode.
- Edit – Open for editing.
- Select Publish – Publish the dashboard after confirmation.
- Publish to BrainGrid – Publish to BrainGrid after confirmation.
- Delete – Delete the dashboard after confirmation.
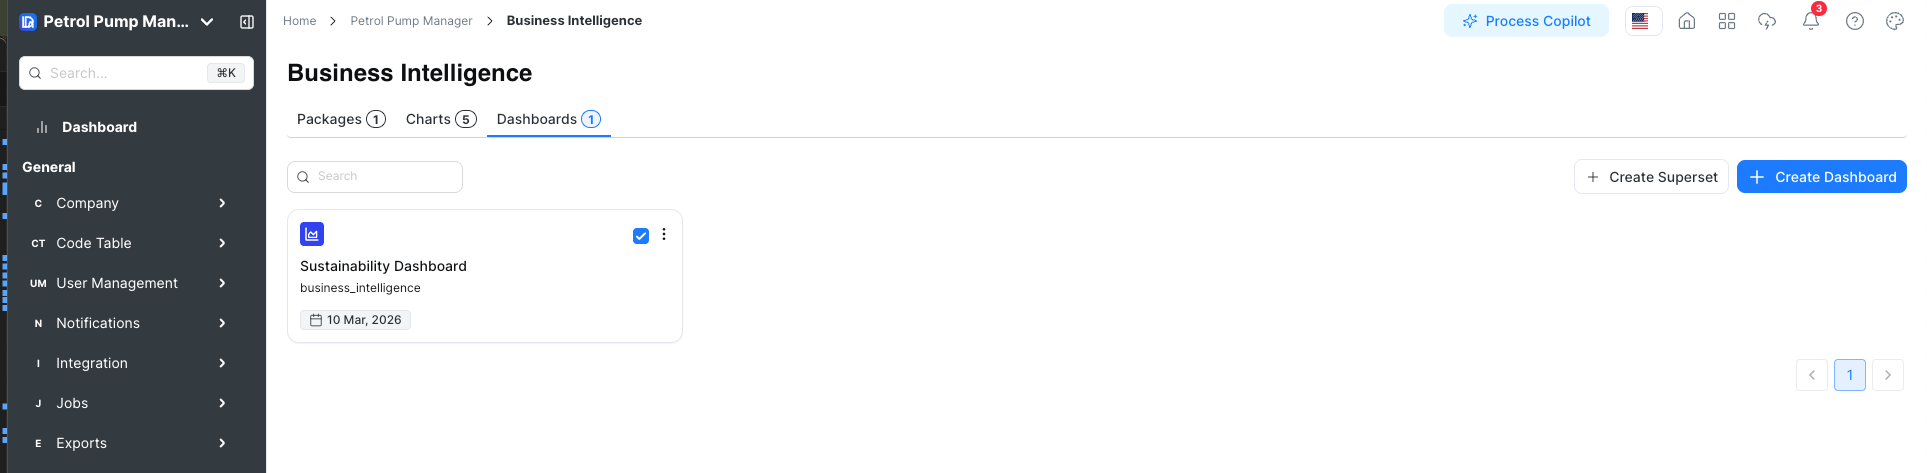
Click the dashboard card to select it. Access all actions via the menu icon on the card.
Dashboard Card
(for example: View, Edit, Select Publish, Publish to BrainGrid, Delete)
All publishing and deletion actions require confirmation to prevent accidental changes.
-
Select Selects the dashboard card to perform further actions
-
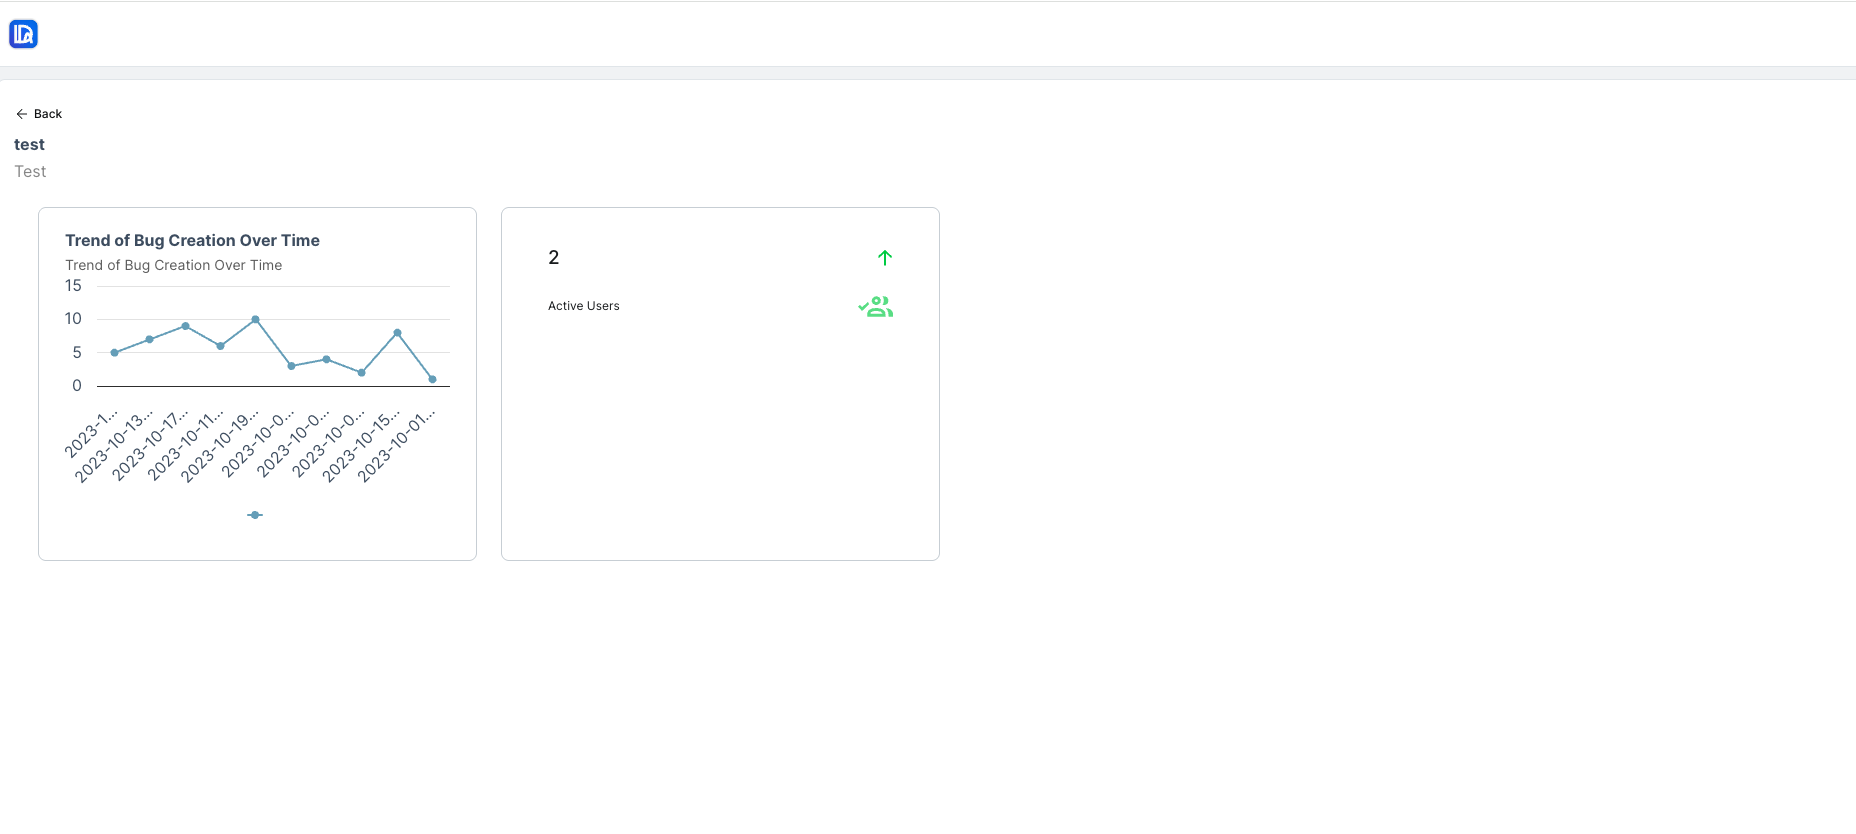
View
Opens the dashboard in view-only mode. -
Edit
Opens the dashboard in editable mode, allowing modifications to charts, layouts, and settings. -
Publish
Opens a confirmation modal. Click Save to publish the dashboard. -
Publish to BrainGrid
Opens a confirmation modal to ensure correct publishing to BrainGrid. Click Save to publish the dashboard. -
Delete
Opens a confirmation modal. Confirm deletion to permanently remove the dashboard.
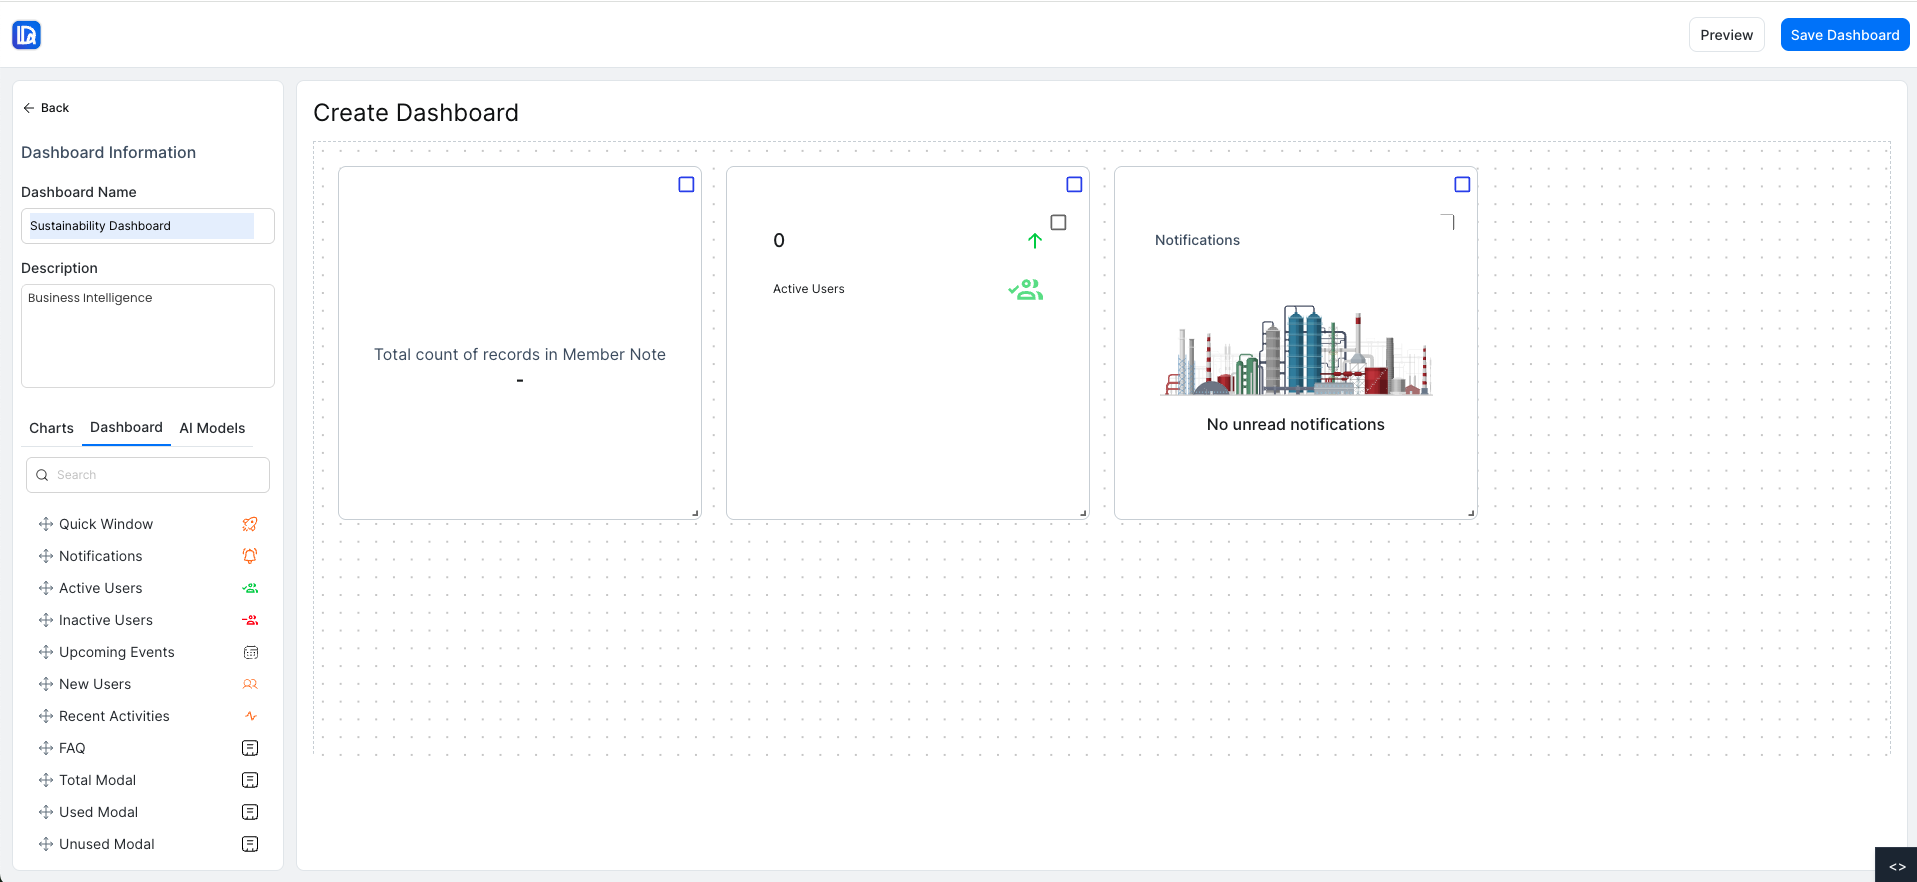
Step-by-Step Guide to Create a Dashboard
Access the Create Dashboard Section
- Ensure you are logged in as an authenticated user with access to Business Intelligence.
- Navigate to the Create Dashboard section.
View Available Charts
- All available charts are displayed.
- Use the search field to filter charts by name.
Use the search field to filter charts by search term.
- Use the filter option to filter charts by visualization type.
Use the filter option to show only charts matching the selected visualization type.
Drag and Drop Charts to Canvas
Global Dashboard Widgets
Default widgets such as "Quick Window", "Recent Activity", "Upcoming Event", "FAQs", "New Users" are available.
- Drag charts from the list to the main canvas.
- Reposition and resize charts as needed.
- Delete charts from the canvas if required.
Enter Dashboard Details
- Enter Dashboard Name.
- Enter Description.
Create the Dashboard
- Click Create Dashboard to save the new dashboard.
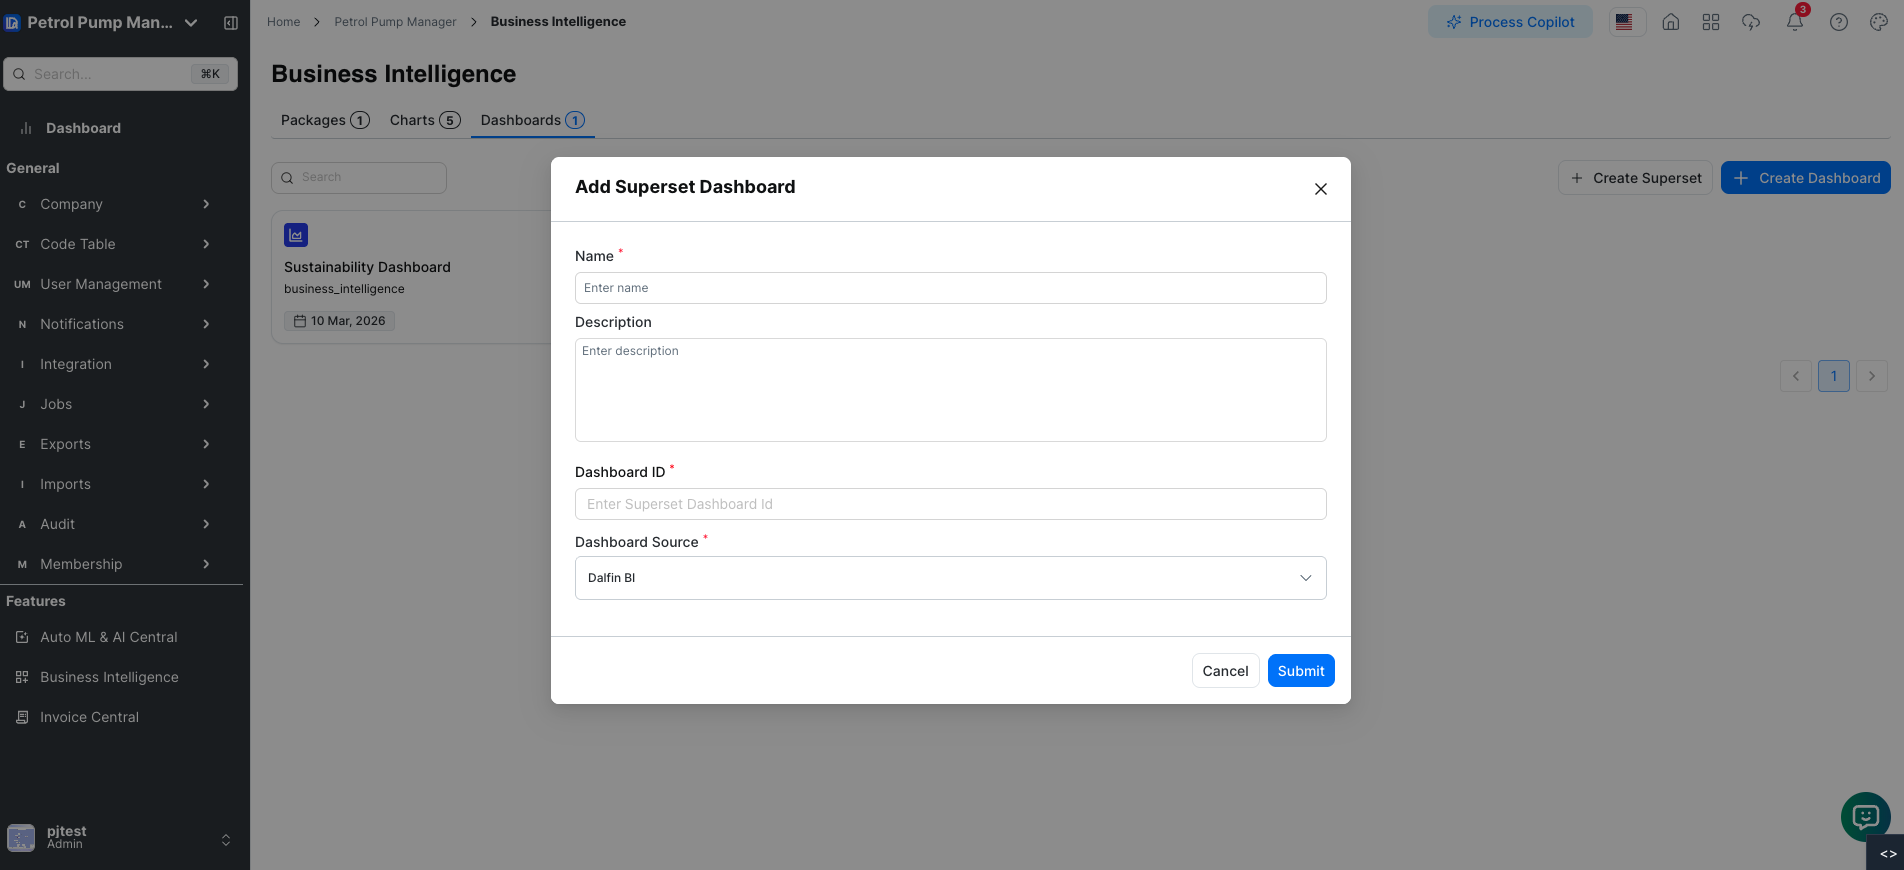
Create a Superset
- Click Create Superset to generate a new superset.
- Fill in the required fields:
- Name
- Description
- Dashboard ID
- Click Save to create the superset.
Dashboard Creation Outcome
- Successful Creation: Redirected to List of Dashboards.
- Failed Creation: Validation error message displayed.
Menu Icon Actions Workflow
- Click Menu Icon on a dashboard card.
- Select any action from View, Edit, Select Publish, Publish to BrainGrid, Delete.
- For actions requiring confirmation (Publish, Publish to BrainGrid, Delete), a modal appears.
- Confirm action by clicking Save (or Delete) in the modal.
- The dashboard is updated according to the selected action.
Follow these steps to correctly create, edit, publish, and manage dashboards and supersets in Business Intelligence. All menu actions have safeguards to prevent accidental changes.