Create a New Chart
Overview
In Business Intelligence, charts can be created using data from packages and visualized using different chart types.
You can configure chart options, apply filters, and preview the chart before creating it.
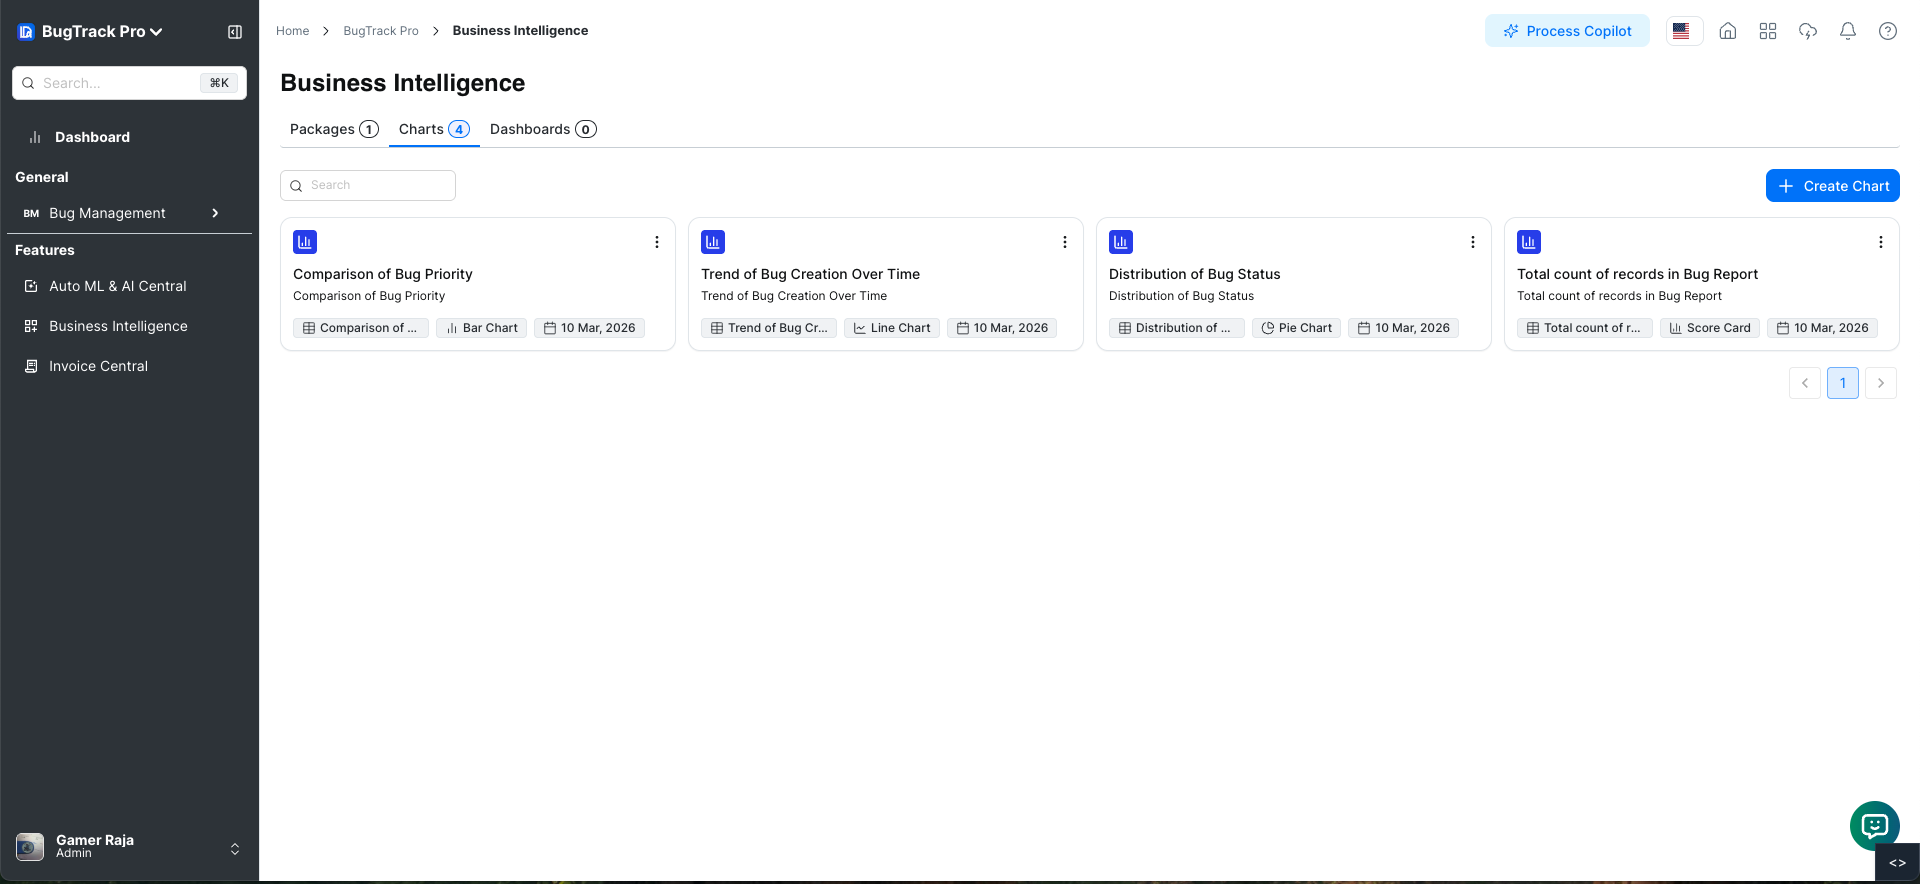
Chart Card
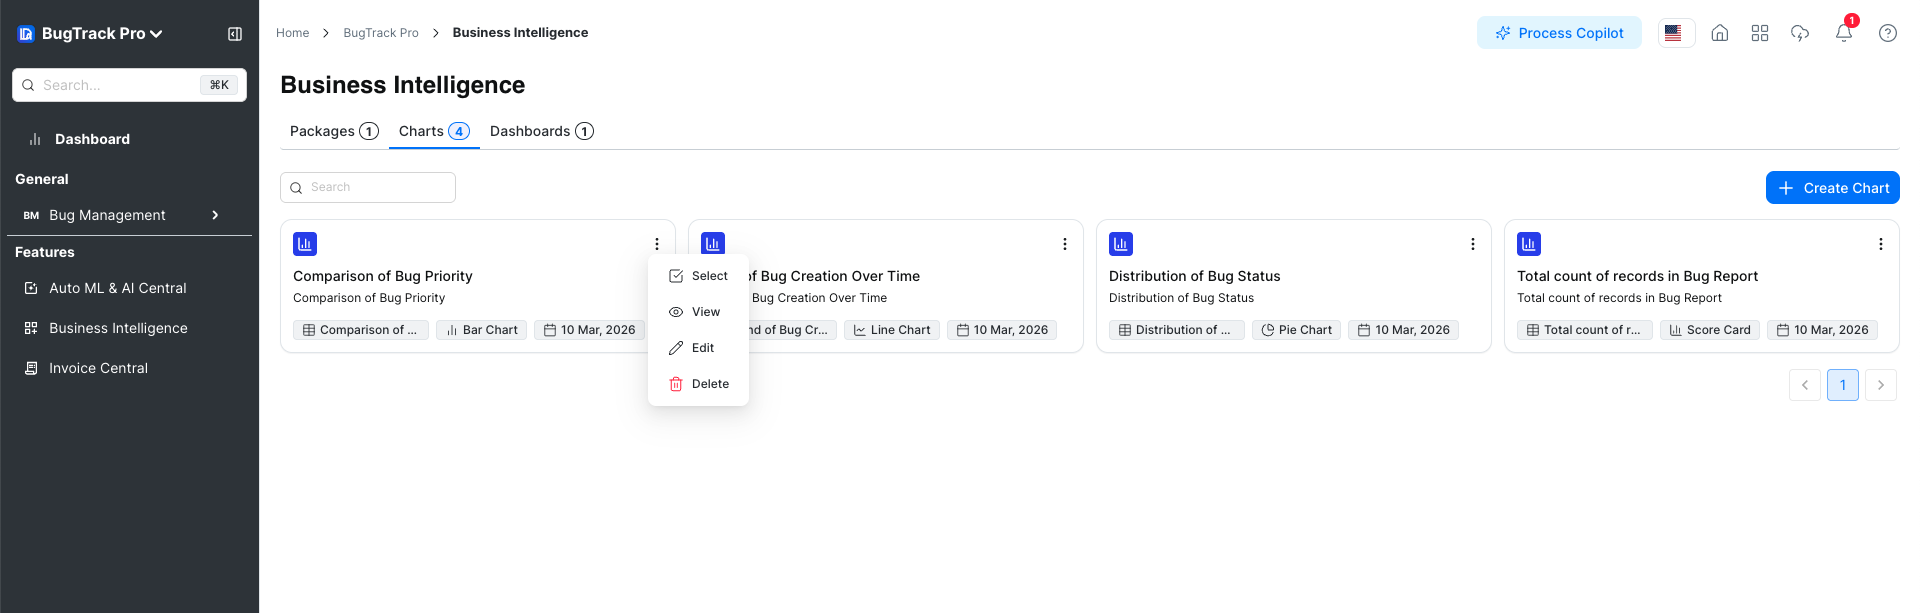
Each chart card contains a menu icon with the following options:
- Select – Select the chart card to perform bulk actions.
- View – Open chart details.
- Edit – Edit chart configuration and filters.
- Delete – Delete the chart after confirmation.
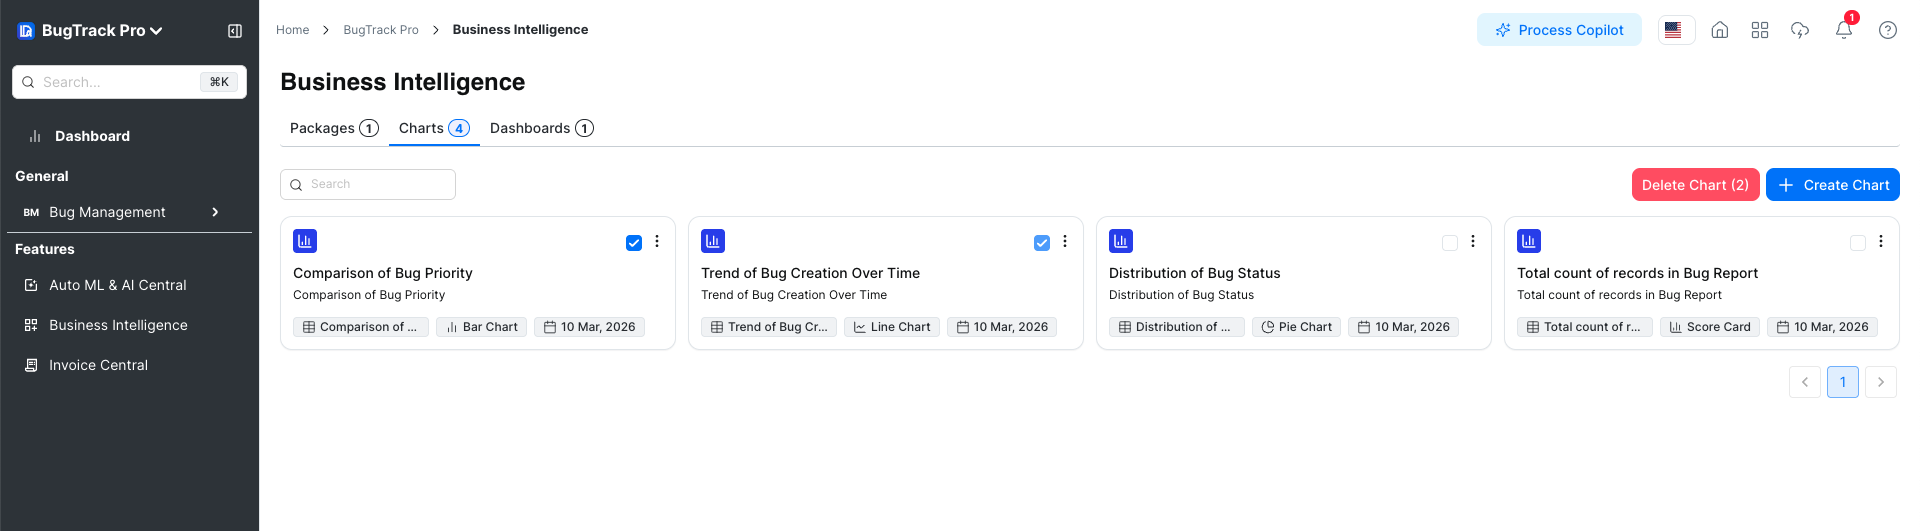
Select Chart
- Clicking Select marks the chart card.
- Multiple charts can be selected.
- Selected charts can be deleted together using the delete action.
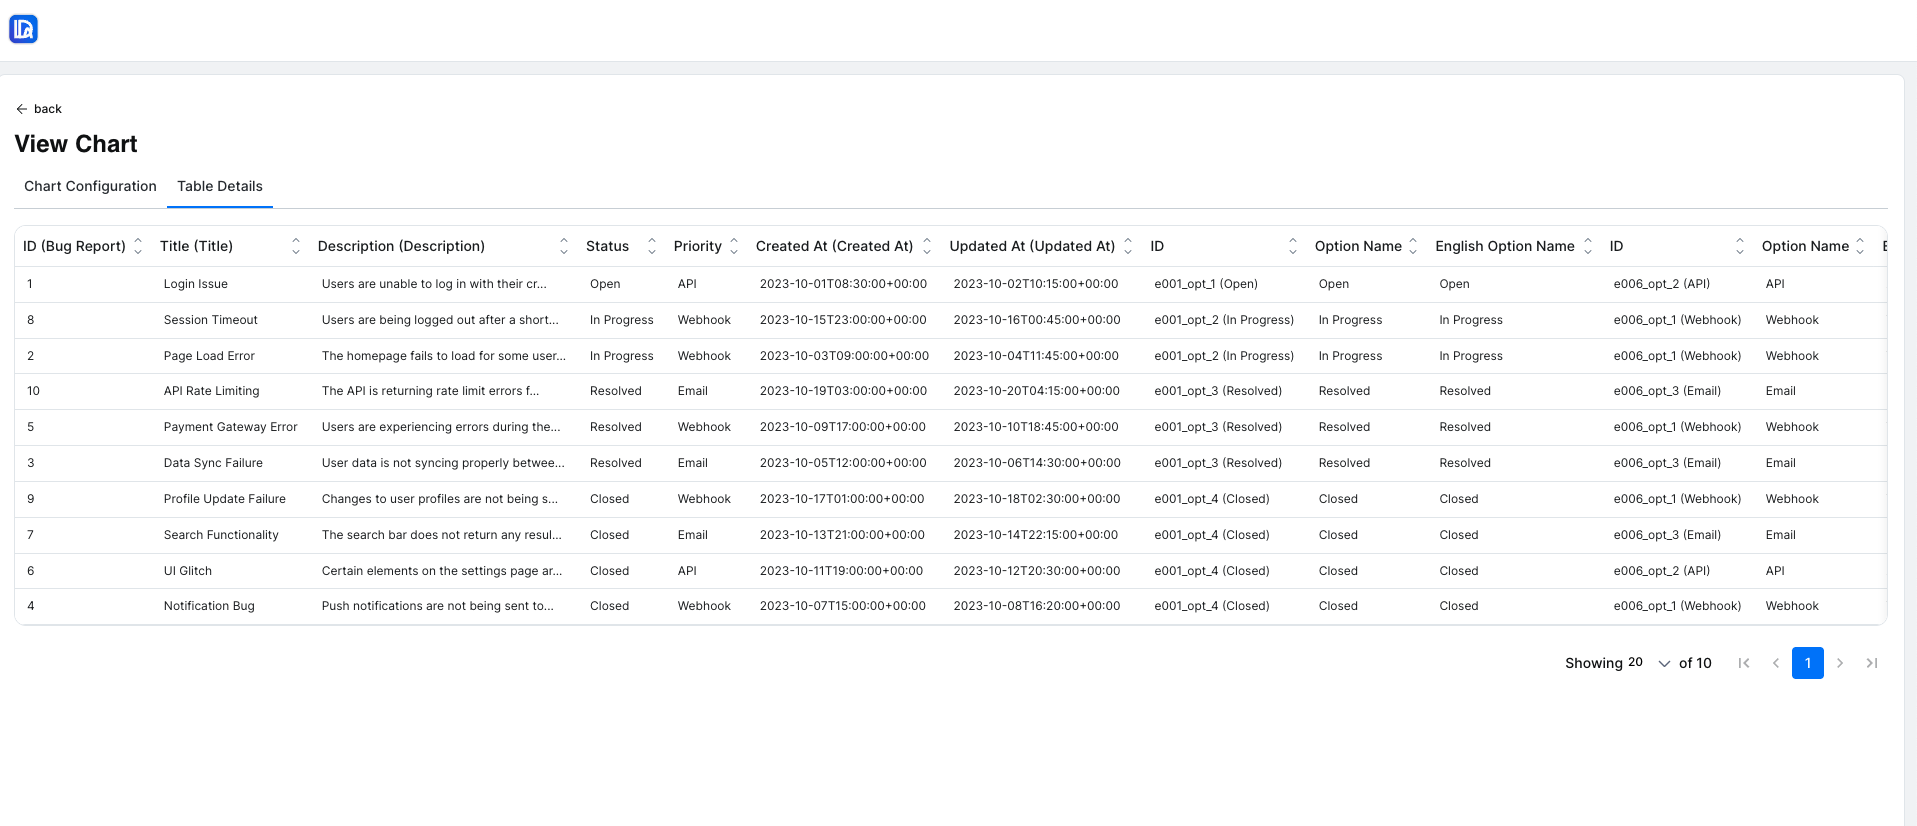
View Chart
Clicking View opens the chart details modal with two tabs:
1. Chart Configuration
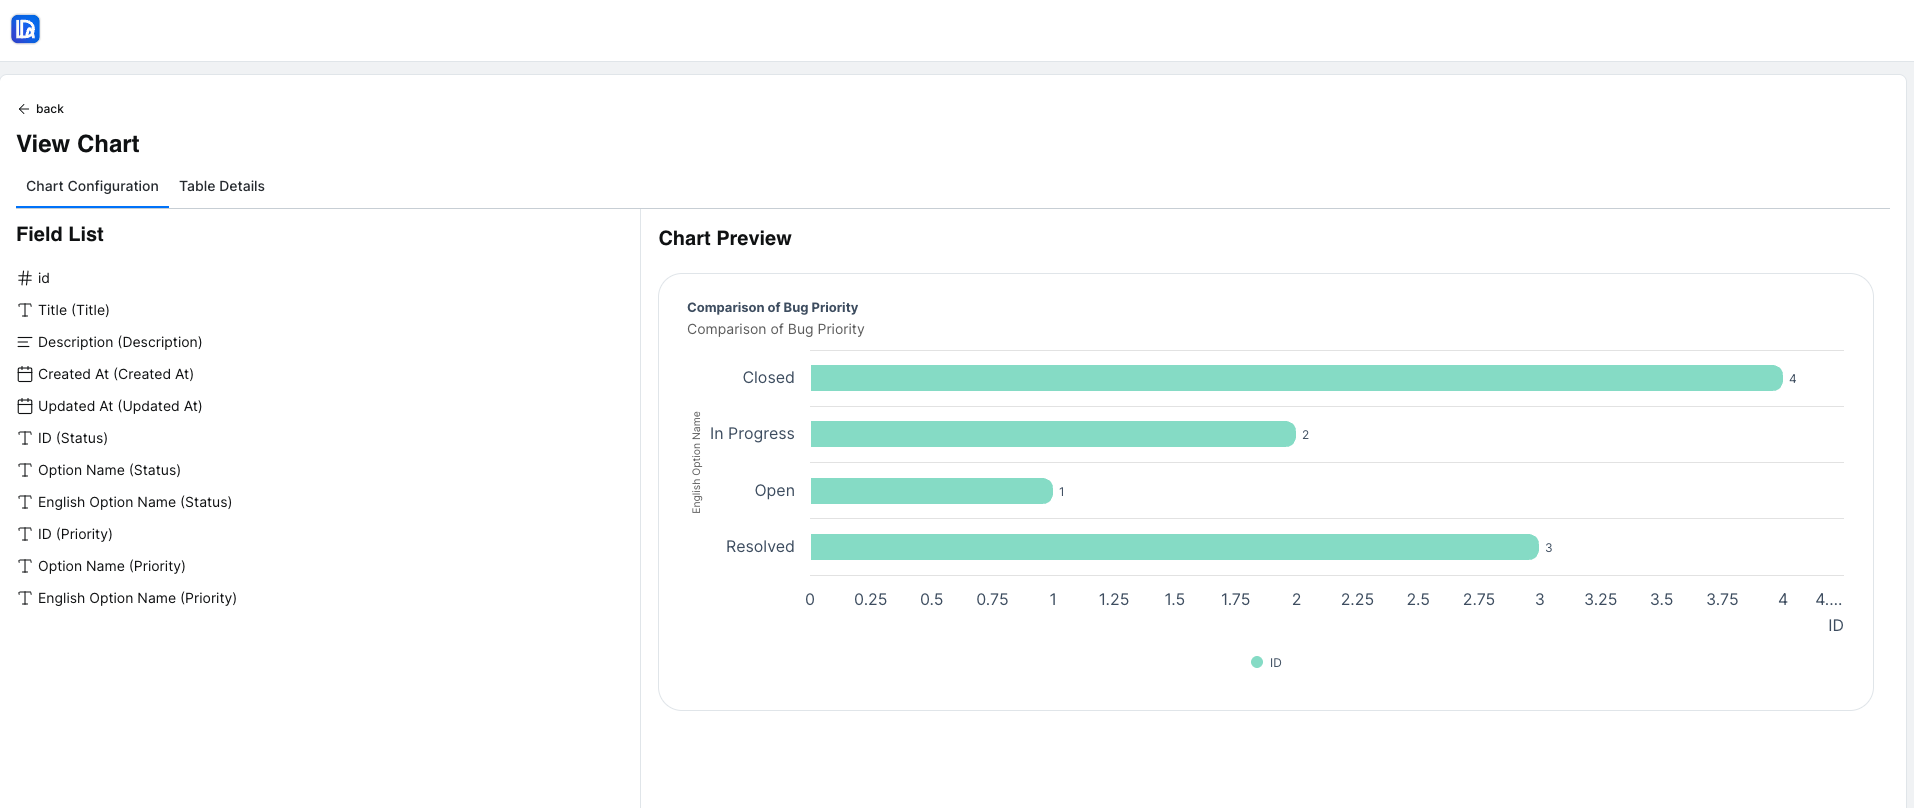
Displays chart information including:
- Chart Name
- Description
- Visualization Type
- Chart Options
2. Table Details
Displays the underlying data tables and selected fields used for the chart.
Edit Chart
Clicking Edit opens the chart in edit mode, allowing updates to chart configuration, table details, and filters.
Configuration
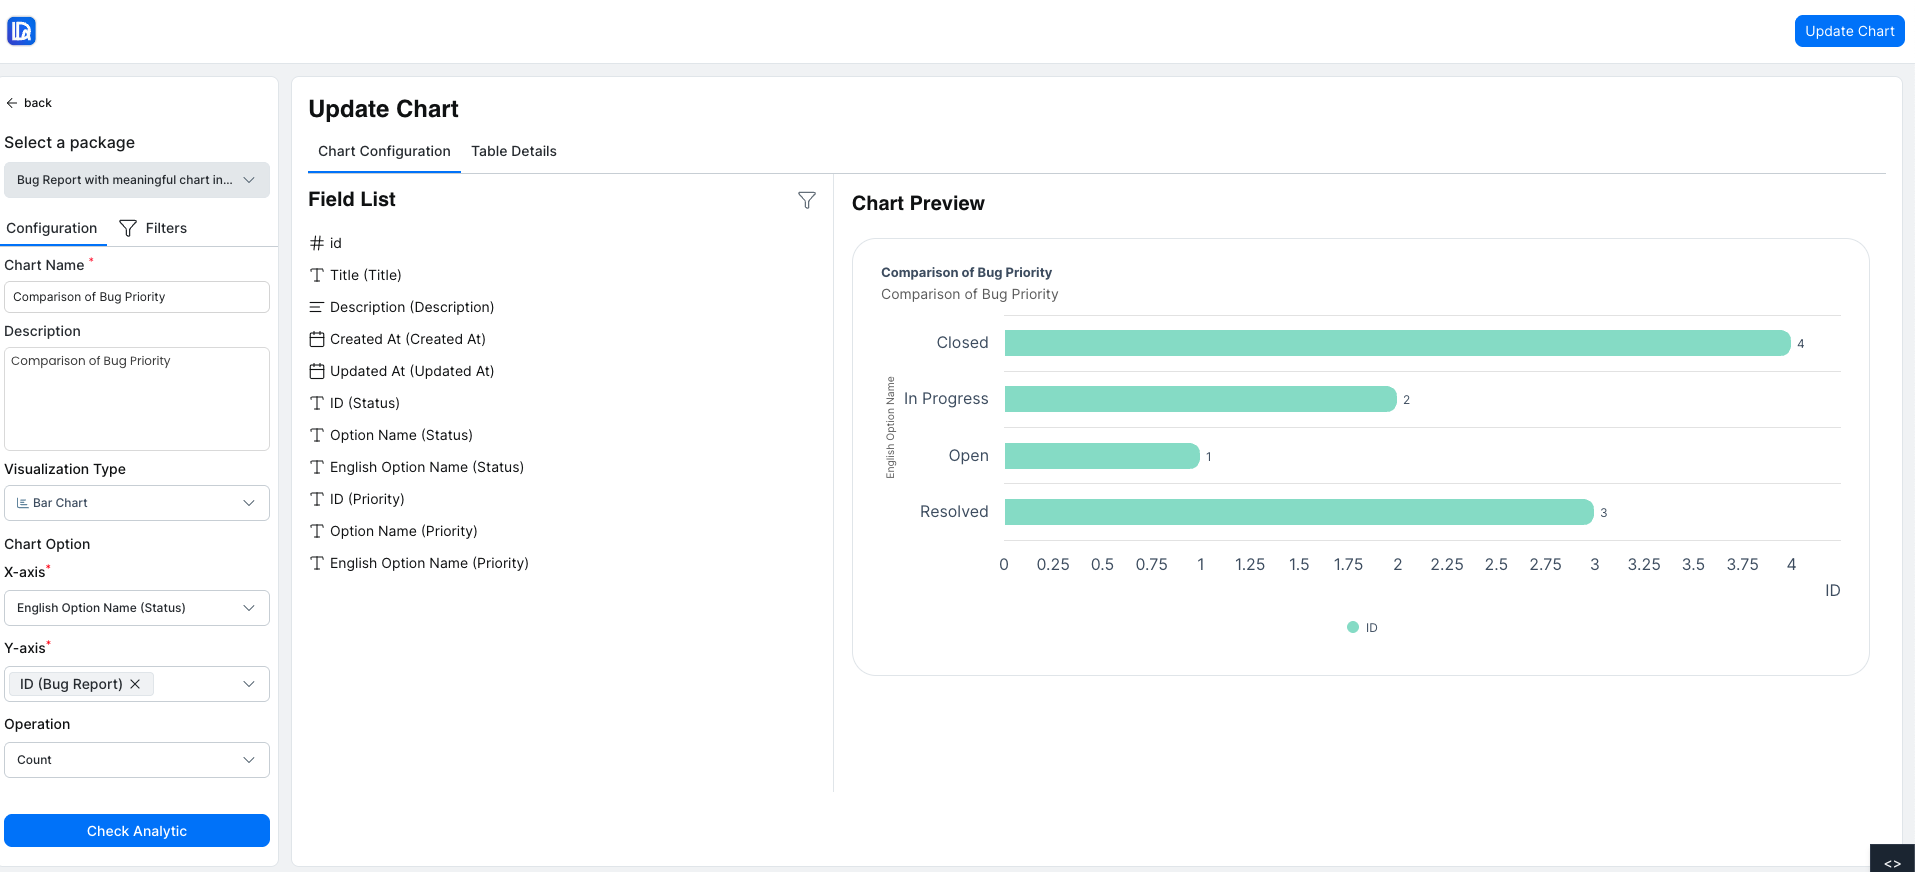
The Configuration tab allows you to modify the chart settings:
- Chart Name
- Description
- Visualization Type
Chart Options
Configure the chart data including:
- X Axis
- Y Axis
- Operations
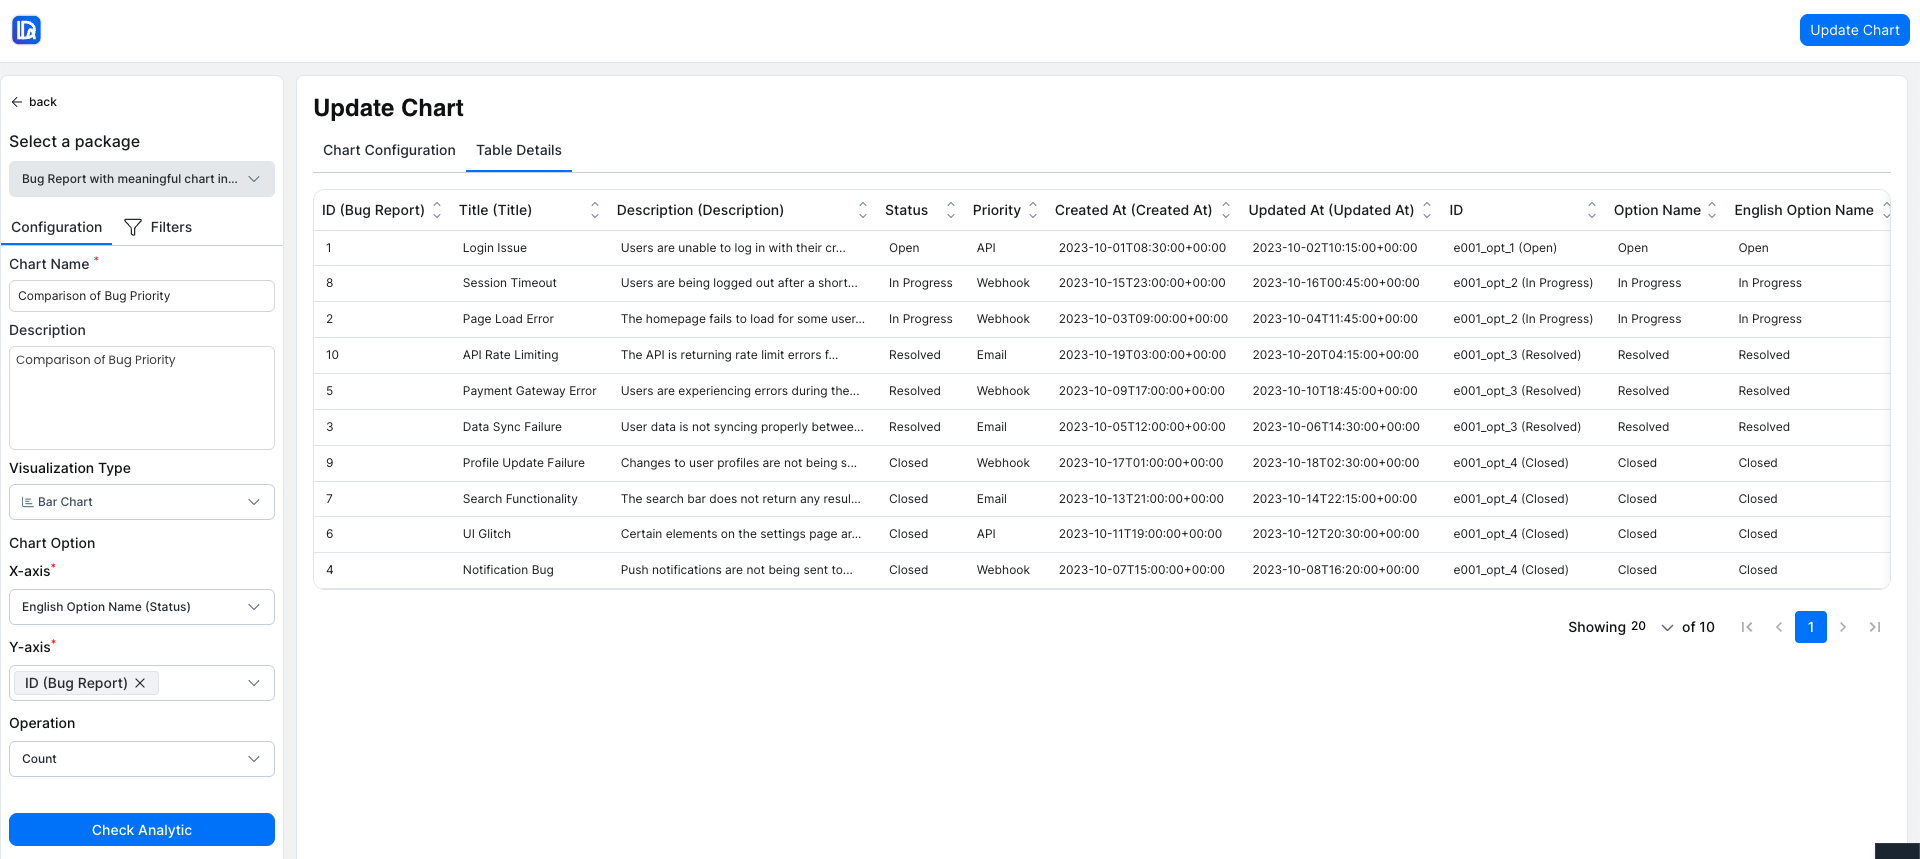
Table Details
The Table Details tab displays the tables and fields used in the chart and allows updating the selected fields if required.
Filters
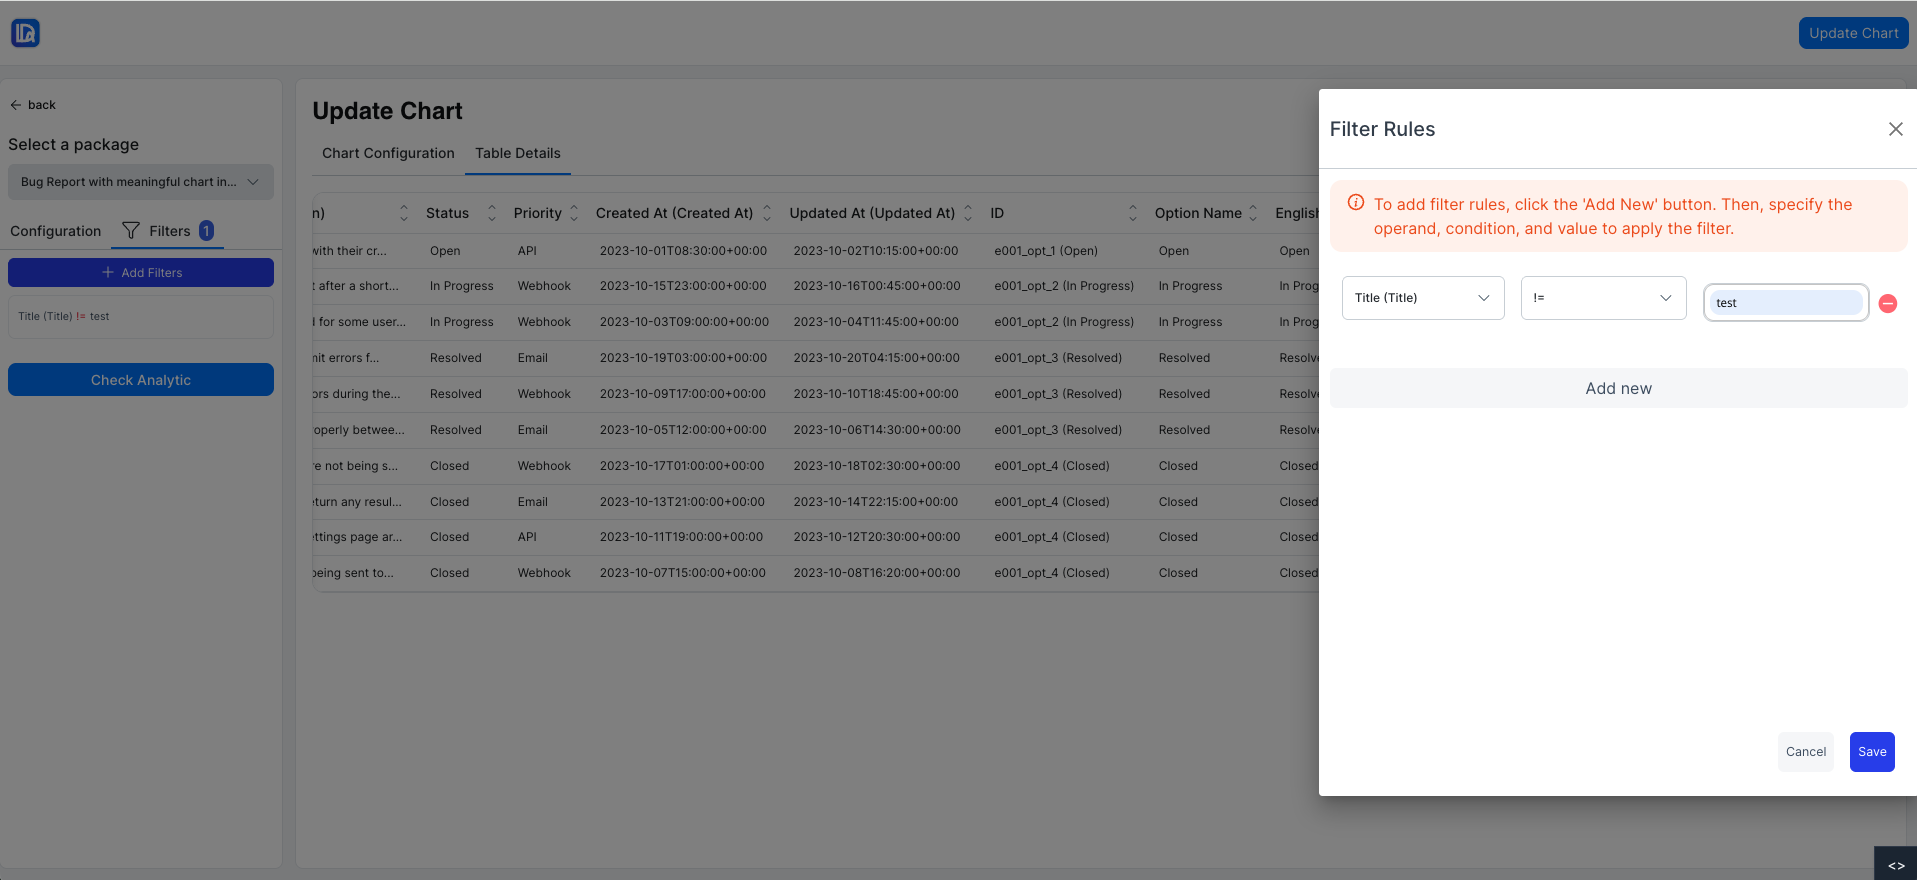
The Filters section allows you to refine the chart data.
- Click Add Filter to add filter conditions.
- Select a column and specify the filter value.
- Multiple filters can be added based on requirements.
Save Changes
- Click Save to apply the updates and store the modified chart configuration.
Delete Chart
- Clicking Delete opens a confirmation modal.
- Confirm the action to permanently delete the chart.
Step-by-Step Guide
Access the Create Chart Section
- Ensure you are logged in as an authenticated user with access to Business Intelligence.
- Navigate to the Create Chart section.
View Available Packages and Input Fields
- A list of all available packages will be displayed.
- Input fields for Chart Name and Description will be visible.
- A section for Visualization Type will display all available chart options.
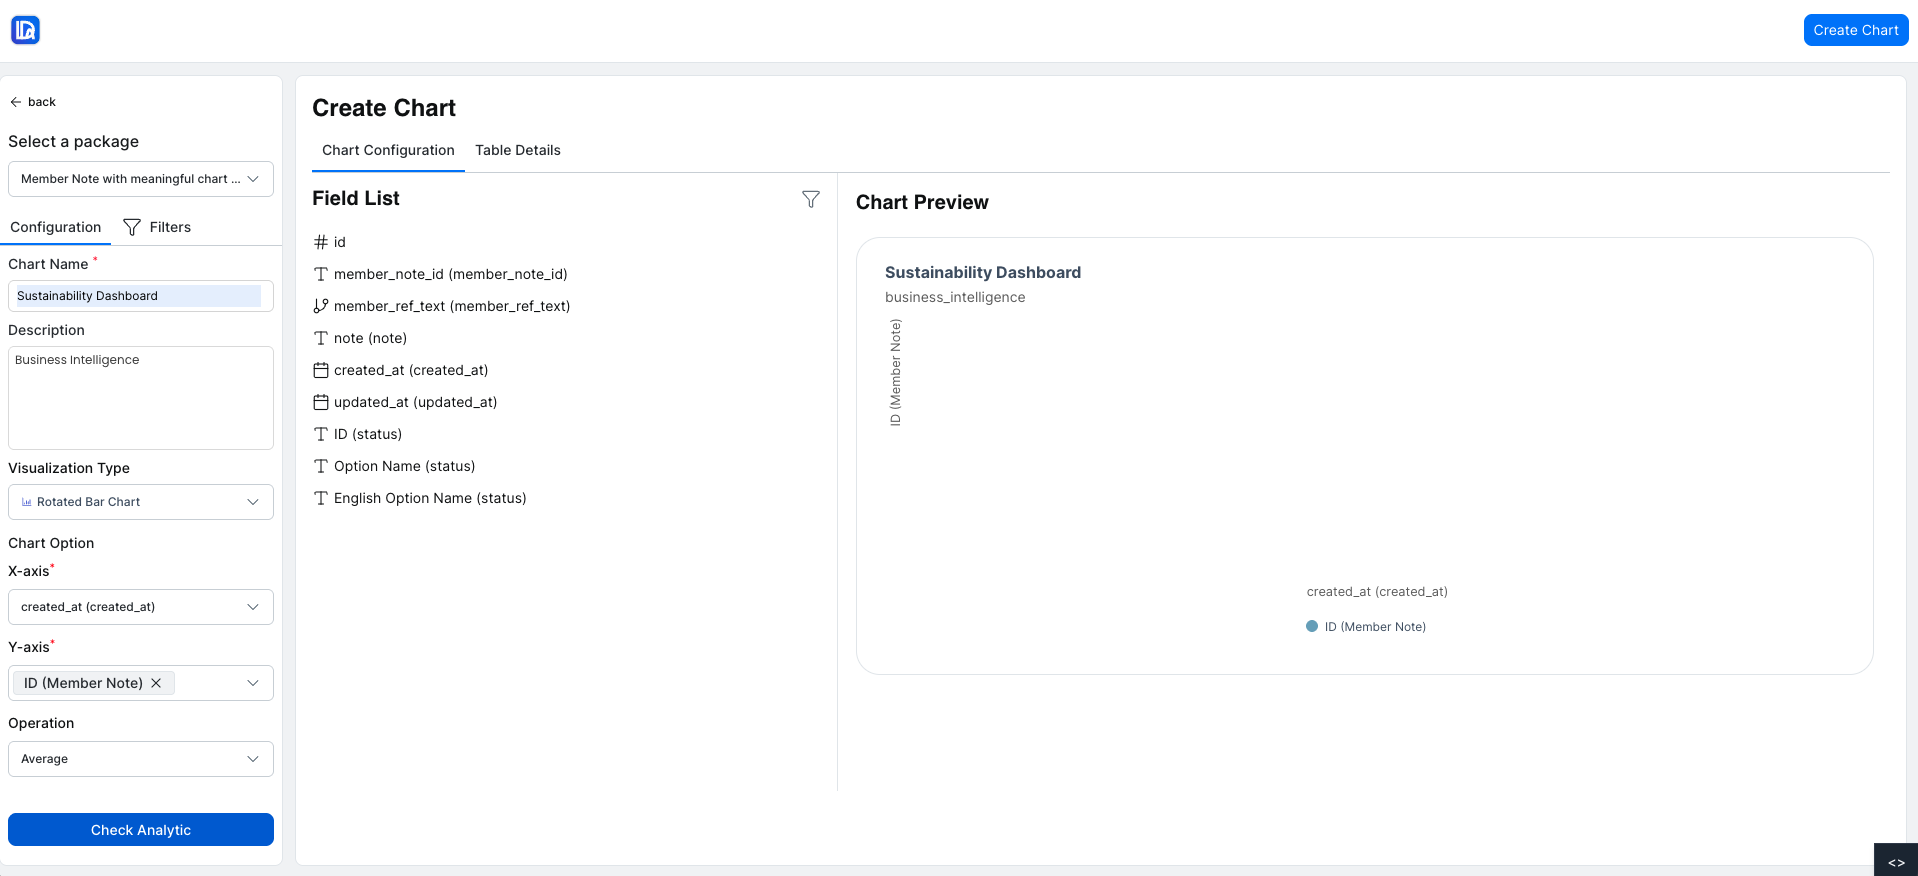
Create a New Chart
-
Select a Package
Choose a package from the list of available packages. -
Enter Chart Details
Enter the Chart Name and Description. -
Select Visualization Type
Choose a visualization type from the available chart options. -
Configure Chart Options
Configure the chart options depending on the selected visualization.
A preview of the chart and table will appear on the right-hand side based on the selected configuration.
Add Filter Conditions
- Add filter conditions by selecting a column and defining the value.
The chart data will update based on the applied filter conditions.
Create the Chart
- Click Create Chart to generate the chart.
Chart Creation Outcome
- Successful Creation
You will be redirected to the List of Charts, and a success message will be displayed.
- Validation Error
A validation error message will appear if required fields are missing or incorrect.
Visualization Types
This guide provides a comprehensive overview of creating, viewing, editing, and managing charts within Business Intelligence. Follow these steps to successfully create charts and visualize data using different visualization types.