View Manager
The View Manager lets you configure how records in a window are displayed. Each window can have multiple views active at the same time, and users can switch between them in the live application.
Accessing View Manager
Click the View Manager icon in the left sidebar. Select any window from the sidebar to open it in the canvas.
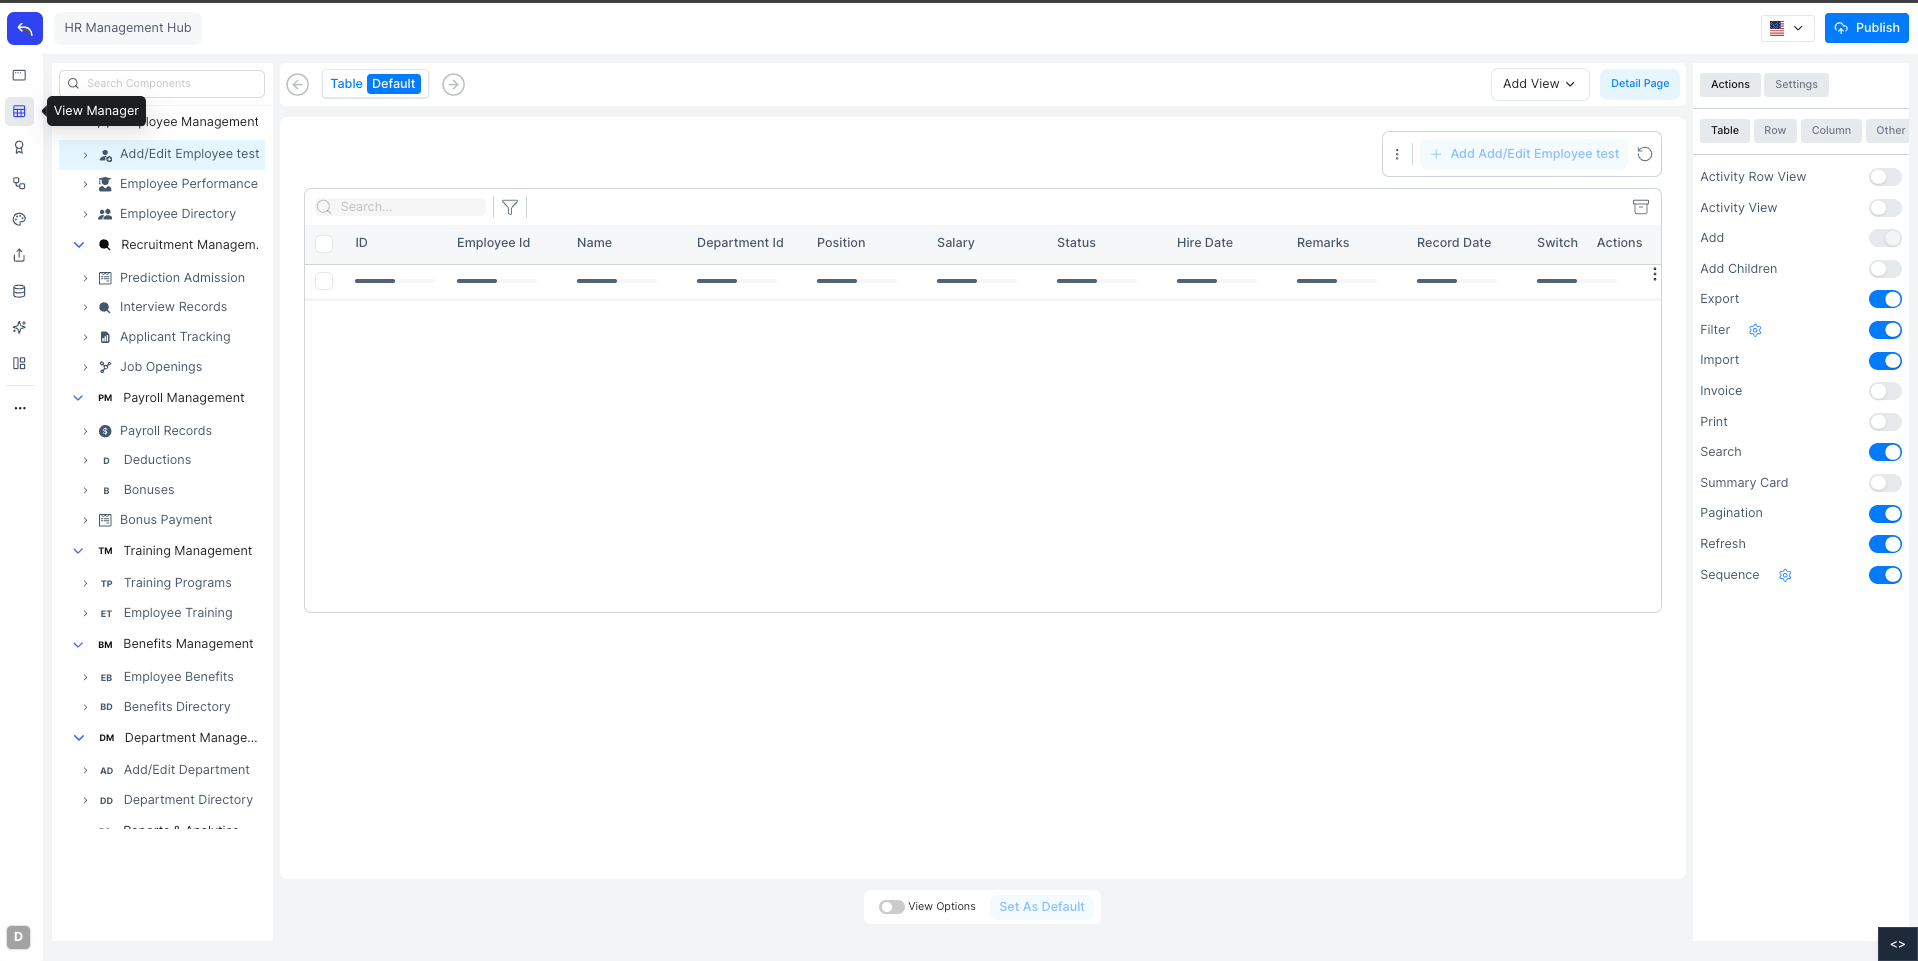
The canvas shows the current views as tabs across the top. The right panel has two tabs: Actions (to configure what actions are available) and Settings (for the selected view's configuration).
Adding a View
Click Add View in the top bar to see all available view types.
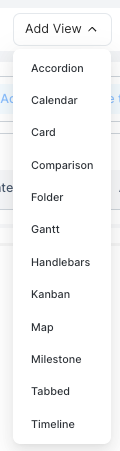
Available view types: Accordion, Calendar, Card, Comparison, Folder, Gantt, Handlebars, Kanban, Map, Milestone, Tabbed, Timeline.
Each view you add appears as a new tab in the canvas. You can add multiple views of different types to the same window.
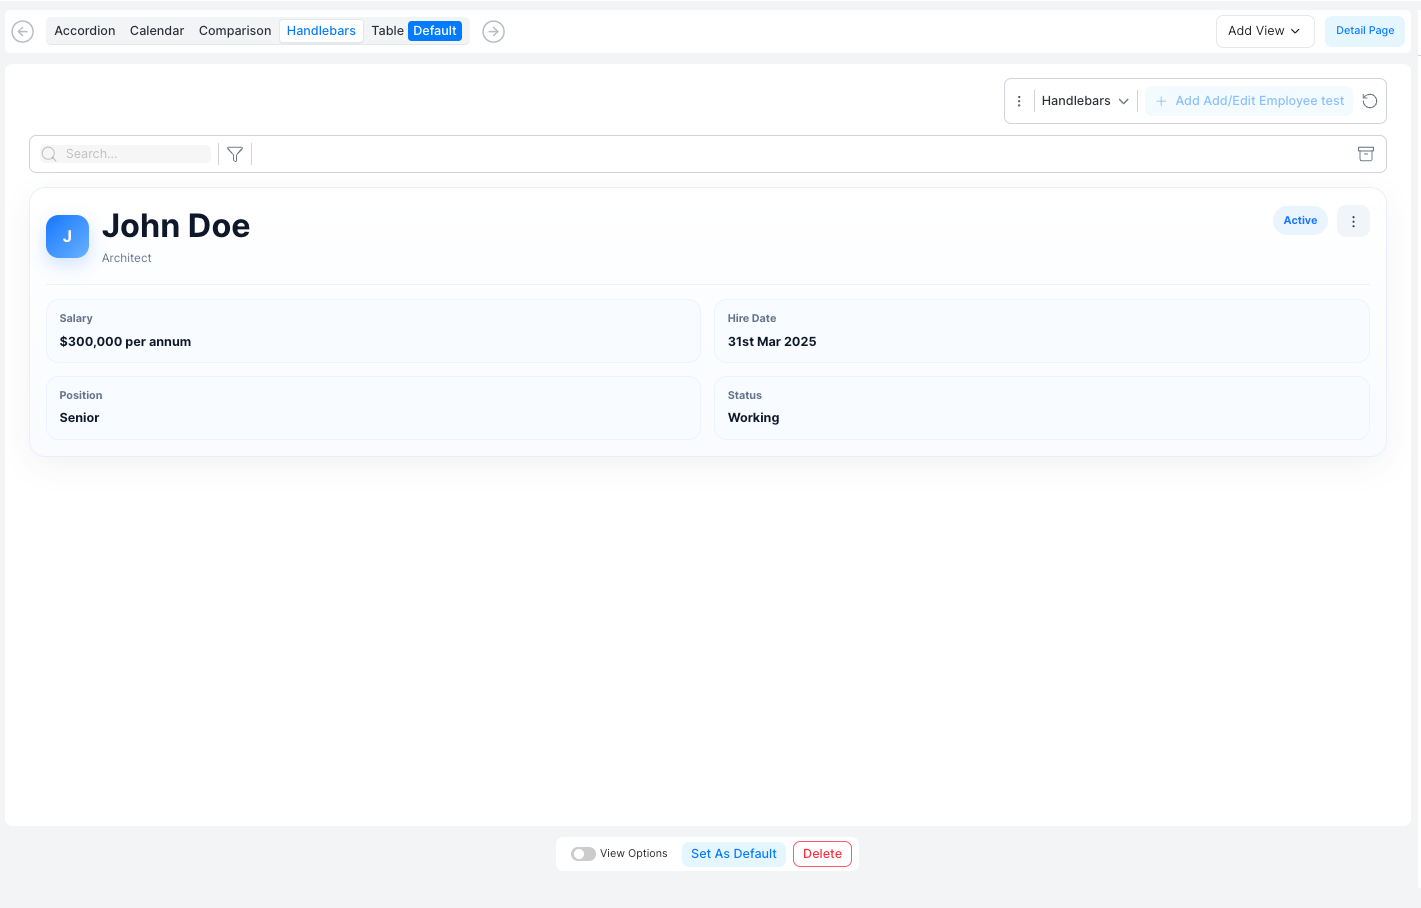
Setting a Default View
At the bottom of the canvas, toggle View Options to show the Set As Default button. Click it to make the current view the one users see when they first open the window.
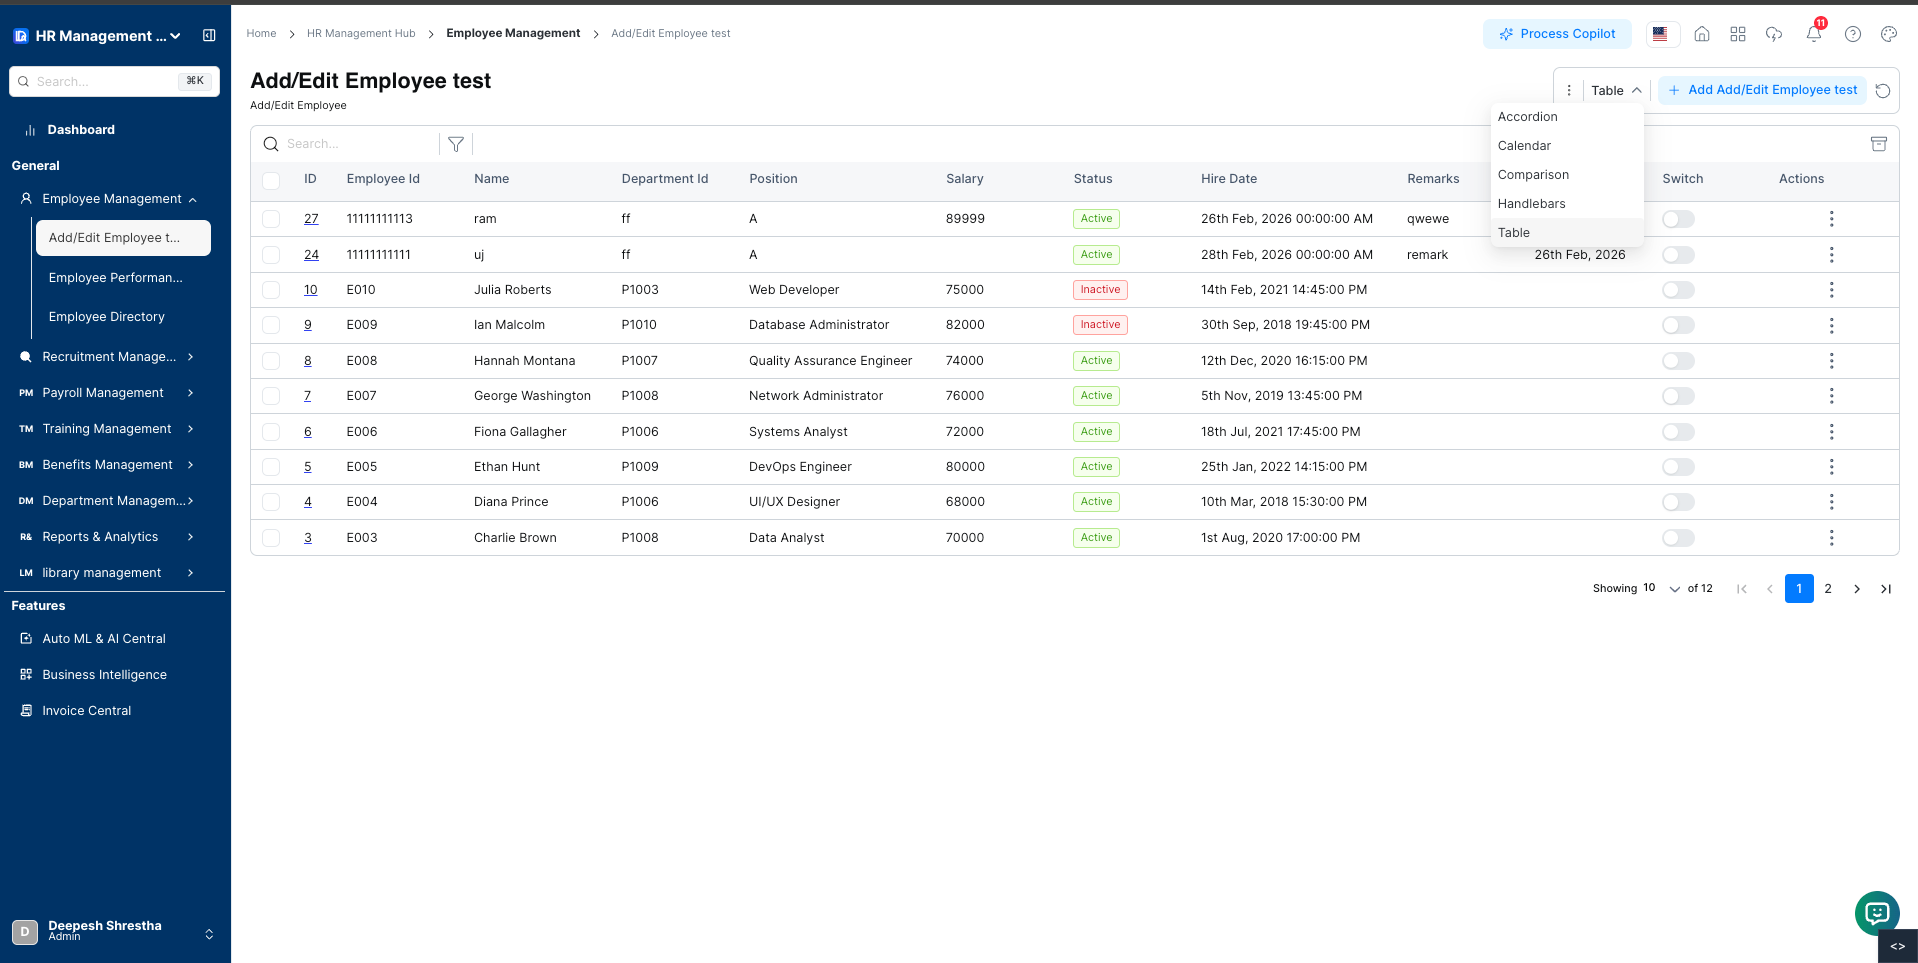
Switching Views in the Application
In the live application, users can switch between views using the view dropdown next to the window title.