Gantt
The Gantt view shows records as horizontal bars on a timeline, with each bar spanning from a start date to an end date. It is useful for visualizing project schedules and task durations.
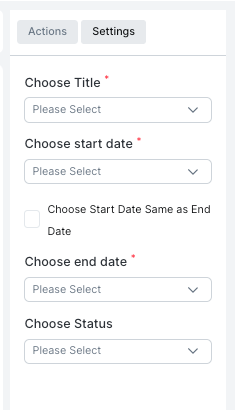
| Setting | Description |
|---|---|
| Choose Title | The field shown as the bar label |
| Choose start date | The field used as the bar's start date |
| Choose Start Date Same as End Date | If checked, the bar spans only one day |
| Choose end date | The field used as the bar's end date |
| Choose Status | The field used to color-code or indicate status |